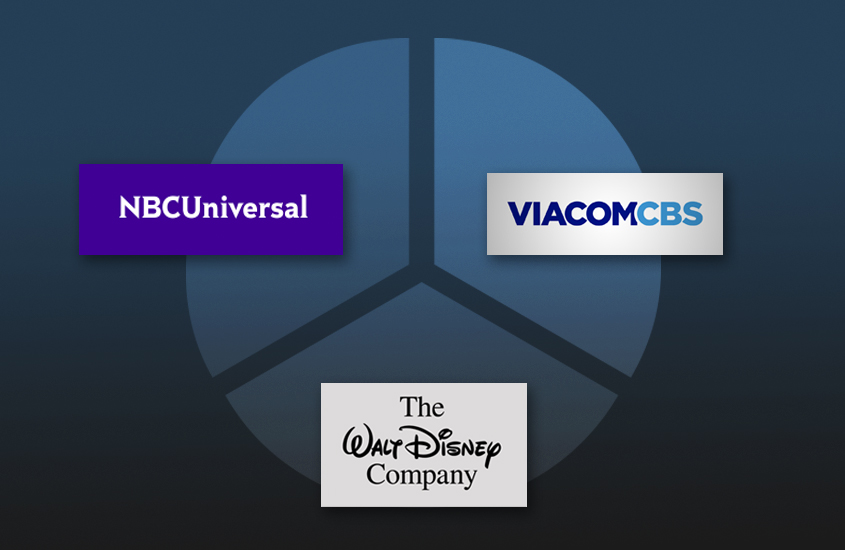
According to the Rule of Three in economics, all industries mature into three dominant competitors. And that’s certainly evident in the linear TV business. Between them, ViacomCBS, NBCUniversal Media and The Walt Disney Co. now have a 55% share of all ad revenue on National broadcast and cable TV channels during the 2018-2019 broadcast year. That’s according to a new finding within Standard Media Index’s (SMI’s) AccuTV ad intelligence platform, powered by Nielsen Ad Intel.
The recently merged ViacomCBS was No. 1 in the rankings, with 20.1% of total ad spend – with a particular dominance in Entertainment programs (at 20.8% of all revenue in that category) and Kids programming (where it enjoyed a massive share, 75.3%, behind the Nickelodeon brand – much of Disney’s Kids programming is not ad-supported).
NBCUniversal was right behind, at 18.4% of total spend across all programming. With MSNBC and CNBC in its stable, the company has an outsized presence in news, garnering a 32.2% share. And its results for General Entertainment shows were certainly substantial, at 17.4%.
Not surprisingly, Disney showed particular strength in sports, given its ESPN powerhouse. The company’s share of ad spend across all genres was 16.2%. In the Sports marketplace, it came in at 29.9%.
ever, marketers’ commitments for entertainment and news represented less than half of all linear ad spend, at 49% or $21.5 billion.
Flat is definitely the new up for legacy video publishers. Audience levels have dipped between 10% and 20%, due to viewer fragmentation. But linear TV is very resilient in the face of this. Overall revenue fell a mere 1.5% on an average weekly basis when the 2018-19 year is compared with 2016-17.
An analysis of total National linear TV spend across all channels shows:
- $44.2 billion in 2018-19;
- $46.6 billion in 2017-18;
- $45.6 billion in 2016-17.
These numbers reflect spending from the Olympics in February 2018. However, SMI excluded Olympics revenue in a separate analysis of average weekly spending. And that showed a steadier decline:
- $850 million in 2018-19;
- $873 million in 2017-18;
- $876 million in 2016-17.
Among the big four broadcast networks, Fox and ABC were the largest primetime advertising losers. Both were impacted by the departure of several top-rated shows. NBC, on the other hand, was the biggest winner, thanks to a stable body of returning series along with newcomers like Chicago Med and Manifest. A comparison of 2018-19 with 2016-17 showed:
- Fox at -6.3%;
- ABC at -3.5%;
- CBS at -1.7%;
- NBC at +1.4%.
The network numbers are based on a two-year CAGR, to account for the Olympics spending in 2018.
Needless to say, the video programming business never stays the same. New streaming services will add significant inventory back into the market. While competing forms of media will continue to nip at the heels of large linear channels, they could gain new exposure with the introduction of the 5G mobile technology standard. And their ability to provide large audiences and brand safety will assure their importance to marketers for many years to come.


