SMI Releases Market Actuals Through April 2019 and Updated Media Forecasts Through 2023 (Two-year comparison shown to avoid year ago Olympics)
NEW YORK, NY – June 10, 2019 – Standard Media Index, the most trusted source of advertising pricing and spend data in the marketplace, today reported that it currently expects the full U.S. advertising marketplace to expand by 8% in 2019 (excluding cyclical events like the Olympics and World Cup). While major marketers are anticipated to grow a mere 2.5%, small and medium-sized businesses (SMB), who generally self-manage their ad spending through digital tools, will grow by nearly 14%. “Exponential growth can’t last forever as the industry matures, but these growth level declines are much more than an issue of percentages off expanding bases,” said James Fennessy, Standard Media Index CEO.
Of concern to the U.S. ad marketplace is sharp hesitation (maybe hiccup) in digital spending. Major marketers have limited their incremental investments in Search to a tiny +1.6% growth level through the first four months of 2019 via SMI’s Cross-Platform measurement. This is down from double-digit growth through the same point in 2018 (and strong growth for Search for years broadly).
Social, too, has seen incremental investment reduced. The platforms collective saw a still-strong +24% growth level through the first four months of the year. But that was down from +50% in the same period last year. In 2018, Social grew by over $150 million in the January to April period (vs. 2017). In 2019 that figure was “only” $25 million according to SMI’s Cross-Platform Pool measurement service.
Digital Ad Formats across all digital platforms (e.g. Social, etc.) are showing long-term growth (of note is Search’s previously noted short-term slowdown). On a two-year CAGR basis Audio is up 7%, Search is up 10%, Display (driven by Social) is up 11%, and Video tops the list with growth at 15%. Standard Media Index’s Cross-Platform Pool measurement service shows that in 2018, social grew by over $150 million in the January to April period compared to 2017. In 2019, that figure has dropped to “only” $25 million.
Video is Still King
Video is the dominant content and ad format in the U.S. among major marketers with 63% of Major Marketer ad spending being invested with video publishers or, growingly, digital video ads on non-video publishing. Despite a transition over the next five years (and beyond) video will continue to be dominant. Performance marketing will continue to drive SMBs with eCommerce potentially shifting ad dollars to marketing outlays beyond current forecasting expectations.
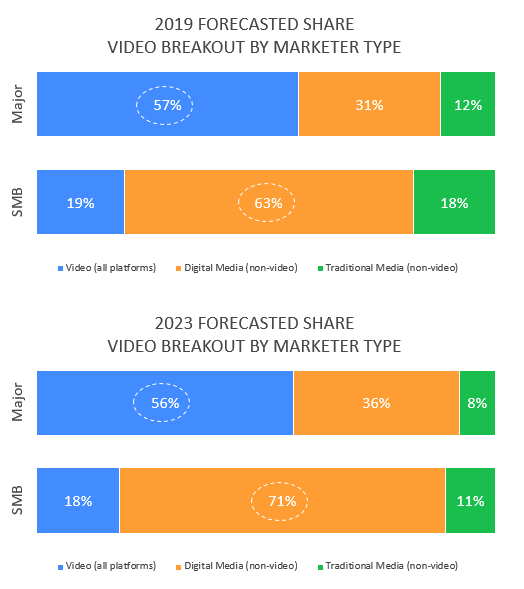
Evolving Media Mix
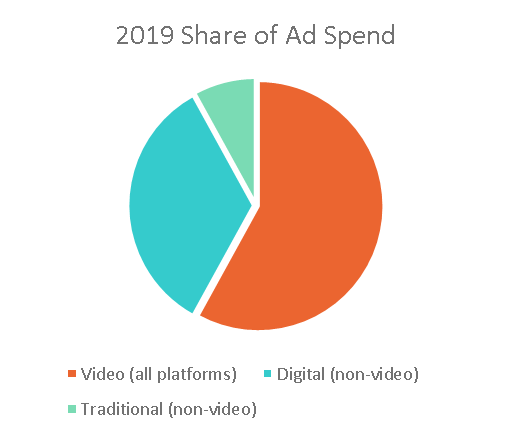
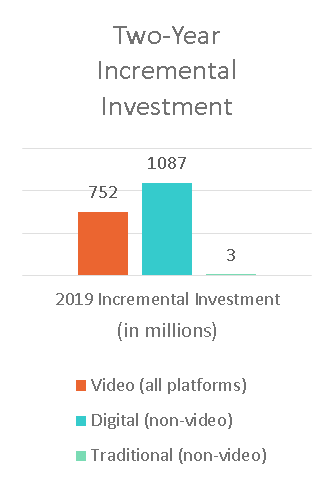
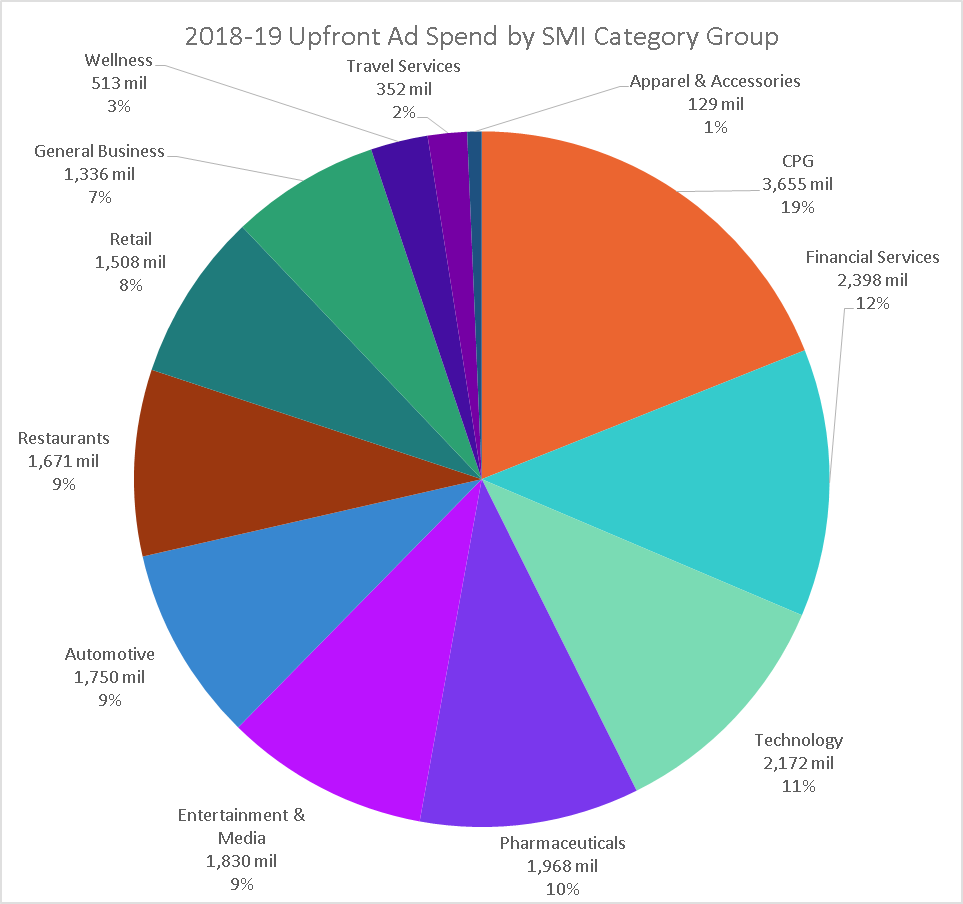
Major marketers continue to migrate to digital media but face headwinds as not all digital environments are ad supported. Video, across all platforms, is the number one ad format for major marketers in the U.S. with 58% of ad spend 2019-to-date and accounts for 41% of incremental investment over the last two years. “Marketers heavily rely on video in the U.S. to build brand awareness and capture user attention. It’s the closest thing to linear television so we can expect to continue to see advertisers increasing their usage of it,” Fennessy said.
National TV
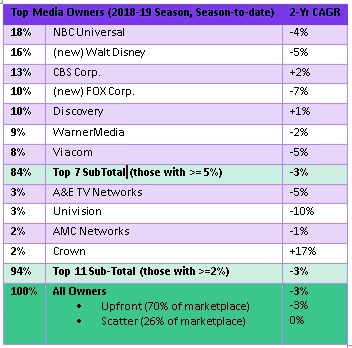
The TV market is concentrated at the top as the top seven media owners account for 84% of ad spend season-to-date (Oct. 2018 – Apr. 2019). To be sure, this is not as consolidated as Search or Social where Google and Facebook, respectively, make up roughly 75% to 85% of those markets. The marketplace has seen erosion of over $500 million per year from Upfront over the last two years. The on-again-off-again recombination of CBS and Viacom could re-create the top media company in the U.S. among major marketers with 12.3% of ad spend. As the National TV market moves into the Upfront Sales cycle, SMI can note that actual delivery of the 2018-2019 season-to-date is not experiencing the level of advertising activity expected last summer.
Upfront Marketers
During the summer of 2018 it was reported Upfront demand was between +3% to +4% overall. SMI’s AccuTV service reports, through April 2019, Upfront revenue is down 0.5% annually (average weekly, Olympics removed from year-ago without replacement). On a two-year basis, Upfront revenue was down 3.6% on an average weekly basis.
This dichotomy between expectations and results have two possible causes. The most likely is that expected results are driven by inflated self-reported figures to industry press. The other is whether (or not) the Options market is strong. There is currently no objective data on the Options market. The 2019-20 Upfront market will undoubtedly be tough for marketers and agencies. Video suppliers are suffering from supply declines which continue to greatly outpace media mix changes by marketers (i.e. demand). This creates a natural upward pressure on the price (e.g. CPM) paid in the market.
Additionally, Standard Media Index anticipates considerable tiering in market prices for large marketers with low bases. It’s quite possible these marketers (with low bases) will be refused outright – media companies knowing their more-limited supply can fetch high pricing in the Scatter market. SMI’s final Upfront forecast, across Broadcast, Cable, and Syndication, will be down 0.7% tied to our collection and reporting of actual figures throughout the season. It’s likely the market will self-report demand at higher annual levels.
This could be a fascinating Upfront season as long-term Upfront marketers, particularly low-base CPG brands, may face a tough environment. Supply losses have been so significant that media owners may move away from tiering low-base brands to allowing only a small portion of their intended commitments. Sell-out levels, too, are in question with significant Scatter premiums likely awaiting the marketplace.

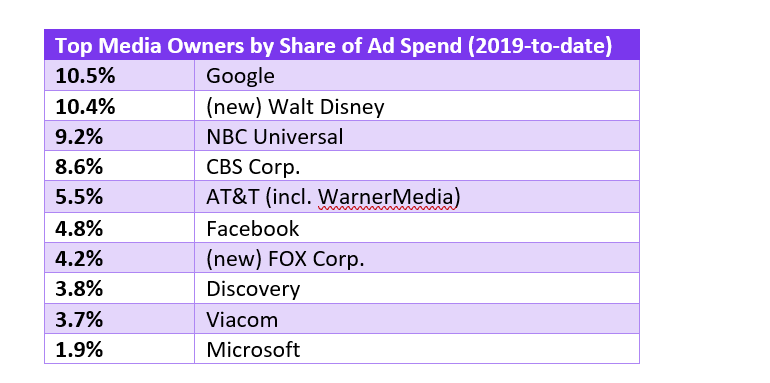
Media Owners
After an Olympics and Super Bowl fueled 2018, NBC Universal falls to third in 2019-to-date with 9.2% of major marketer spend and Google claims the top position, after a tug-of-war with NBCU, at 10.5%. The new Walt Disney Corporation now ranks second with 10.4% of ad spend from major marketers after adding in former 21st Century FOX and Hulu properties back from January-April of 2019.
About Standard Media Index
Standard Media Index is the most trusted source of advertising pricing and spend data in the marketplace. SMI accesses actual agency spend from the world’s largest media buying groups, as well as leading independents, and then organizes that data to create a clear, granular, and easy-to-use database for our clients and agency partners. By aggregating this data, which accounts for 70%+ of all agency spend, SMI offers detailed ad intelligence across all media types, including Television, Digital, Out-of-Home, Print, and Radio. Data can be broken down by ad types, publishers, product categories, and other dimensions. Our data supports insights covering 32 countries around the world. For more information and resources visit www.standardmediaindex.com.
Benchmarking National vs Local/SMB Marketers (Major marketers vs. SMB)
SMI can break the ad marketplace by marketer type (major national marketers vs. SMB/local). Our proprietary forecasting model indicates that digital will not surpass national TV in total spend among national marketers, until 2021. Digital media includes both sets of marketers while national TV, almost by definition, includes only major national marketers. Without this market bifurcation, marketers can get incorrect benchmarks.
Methodology
SMI sources our data from the raw spend from the media agency holding groups to see the actual dollar amounts spent on each ad buy. We work with 5 of the 7 major media holding groups and leading independents – making up 70% of the National TV market. Using SMI real prices paid on spots and combining that with occurrence data from Nielsen Ad Intel, SMI models out the full 100% of the spots in the TV marketplace within Nielsen’s coverage. Market share percentages are comprised of the approximately 130 national TV networks we measure.
For more information, contact:
Samson Adepoju
Director of Marketing & PR
347-840-1774